School districts got bigger. Did school get longer?
117,108 public school districts in 1939-40, 13,318 today. The consolidation is real — but the school year stopped getting longer in 1950, and the extra hours arrived at kindergarten instead.
The dump
I’m really curious what the data say about how school district size in the United States has evolved over time. As a homeschooling family, one of the motivations for us has been this sense that school districts, public schools, have increasingly become these large bureaucracies unto themselves rather than a family community-driven resource. It sort of seems more like an imposition than something bottom-up, right?
I get the sense that if we take a long-arc view of public schooling in the United States, all the way back to the early public schools in New England, there’s been a shift to this industrial model. That has taken away a lot of effective local autonomy and control. There’s school district size, there are financial elements, and quite a few things to explore here. I’d like to validate the extent to which this is true, kind of similar but with a slightly different angle.
I remember when I was a kindergartner, kindergarten was a half-day program, right? Now it’s almost universally full day. By the same token, extracurricular programs, homework, etc., seem like they’re occupying a much greater percentage of a student’s day and therefore a family’s life. In other words, at the same time that school has perhaps become larger, more unwieldy, and out of local control, it’s also consuming and controlling a much greater portion of a person’s or a family’s time and life. I’d also like to validate that idea and see if there is a coherent narrative that the data support here.
And, in a follow-up:
I want to dive deeper into how there’s been this massive consolidation of school districts and an increase in the size of school districts. It’s not just the fiscal control. To what extent do parents meaningfully have input in a sort of democratic fashion?
It seems impossible to me that you can have anywhere near the same amount of personal leverage or stuff like that. A multi-thousand-kid school district represented by a single school board becomes too distant, but I do want to validate that the larger district size does translate, because it’s still just a single school board in most cases. Just a handful of people representing now thousands of kids versus a district of a couple hundred kids. That’s the angle I want to validate for causing a shift or supporting a shift in the care of school districts and the fundamental nature of the relationship between parents and the district.
The question(s)
Two separate claims are bundled together here, and they have to be tested apart. Bigger and further away: did the unit that runs a school actually grow, and did the money for it stop being local? More of a family’s life: did school grow to take more of a child’s year?
The follow-up sharpens the first claim into a third: fewer seats at the table — a district is governed by one small board however large it grows, so did consolidation shrink the number of elected seats relative to the pupils they answer for, or did boards grow with their districts?
The data
What could bear on a long-arc claim about American public schooling:
- NCES Digest of Education Statistics — the annual compendium whose historical tables carry single consistent series back to 1869-70: district counts, revenue by source, term length, kindergarten attendance status.
- NCES Common Core of Data — district-level microdata, but it starts in 1986-87. Right unit, wrong arc.
- Census of Governments — an independent count of school-district governments every five years; a cross-check on the Digest, not a longer reach.
- American Time Use Survey — the only direct measure of hours in a family’s day, but it begins in 2003.
- NAEP long-term trend — carries the homework question, read by the Brown Center report cited below.
- Census of Governments, Popularly Elected Officials — the only official count of elected school-district officials there has ever been. Taken in 1967, 1977, 1987, and 1992, then dropped; published as scanned reports, not data files.
- Digest table 214.20 — districts and students by enrollment size of district, 1979-80 through 2021-22, for where the students actually sit today.
The Digest is the pull: both original claims are long-arc claims, and it is
the only source whose series span the whole arc. Three tables —
214.10
(districts and one-teacher schools),
201.10
(enrollment, school term, revenue by source), and
202.10
(kindergarten by attendance status) — cached into _research/ so every
number can be re-derived from the same bytes a year from now.
The representation question adds two more: table 214.20 is pulled the same way, and the Census of Governments counts are typed in from the published reports — the scans defeat a parser, so the code cites the page and table each number came from.
EDA
# The three Digest tables named above, cached into _research/.
SOURCES = {
    # districts, public schools, one-teacher schools: 1869-70 to 2022-23
    "214.10": "https://nces.ed.gov/programs/digest/d23/tables/xls/tabn214.10.xlsx",
    # historical summary — enrollment, school term, revenue by source
    "201.10": "https://nces.ed.gov/programs/digest/d22/tables/xls/tabn201.10.xlsx",
    # preprimary enrollment by attendance status: 1970 to 2018
    "202.10": "https://nces.ed.gov/programs/digest/d19/tables/xls/tabn202.10.xls",
}

def workbook(number):
    path = RESEARCH / Path(SOURCES[number]).name
    if not path.exists():
        urllib.request.urlretrieve(SOURCES[number], path)
    return pd.read_excel(path, header=None)

def year_of(label):
    """`1939-40` -> 1939, `1999-2000` -> 1999, `2018\\1\\` -> 2018."""
    found = re.match(r"(\d{4})", str(label))
    return int(found.group(1)) if found else None

def value(cell):
    try:
        return float(cell)  # NCES writes "---" where a year has no figure
    except (TypeError, ValueError):
        return None

def across(sheet, row, header_row):
    """One row of a sheet whose years run left to right in `header_row`."""
    pairs = {
        year_of(sheet.iat[header_row, c]): value(sheet.iat[row, c])
        for c in range(sheet.shape[1])
    }
    return pd.Series({y: v for y, v in pairs.items() if y and v is not None}).sort_index()

def down(sheet, column, first_row):
    """One column of a sheet whose years run top to bottom in column 0."""
    pairs = {
        year_of(sheet.iat[r, 0]): value(sheet.iat[r, column])
        for r in range(first_row, sheet.shape[0])
    }
    return pd.Series({y: v for y, v in pairs.items() if y and v is not None}).sort_index()

_t214, _t201, _t202 = workbook("214.10"), workbook("201.10"), workbook("202.10")

# Row positions are hardcoded against the cached workbooks. Asserting each
# one against its own label means a re-download that shifts a row fails
# here rather than quietly plotting the wrong series.
assert _t201.iat[8, 0].strip().startswith("Total enrollment")
assert _t201.iat[18, 0].strip().startswith("Average length of school term")
assert _t201.iat[19, 0].strip().startswith("Average number of days attended")
assert _t201.iat[36, 0].strip().startswith("Local sources")
assert _t202.iat[27, 0].strip().startswith("Full-day kindergarten as a percent")

series = {
    "districts": down(_t214, 1, 5),
    "one_teacher_schools": down(_t214, 6, 5),
    "enrollment_k": across(_t201, 8, 1),
    "term_days": across(_t201, 18, 1),
    "days_attended": across(_t201, 19, 1),
    "local_revenue_pct": across(_t201, 36, 1),
    "full_day_k_pct": across(_t202, 27, 2),
}
tidy = pd.concat(series, names=["series", "year"]).rename("value").reset_index()
tidy.to_csv(RESEARCH / "nces-long-arc.csv", index=False)
tidy
# Coverage before claims: the Digest samples decades before it samples
# years, and a series is only as good as the points beneath it. The
# helpers above already dropped the cells NCES marks "---".
print(
    pd.DataFrame(
        {
            _name: {
                "first": int(_s.index.min()),
                "last": int(_s.index.max()),
                "points": len(_s),
            }
            for _name, _s in series.items()
        }
    ).T
)
# Printed, not interpolated: `mo.md(f"...")` stops being Markdown and lands
# on the page as a code block, so the prose below quotes these by hand.
_d, _e = series["districts"], series["enrollment_k"]
for _y in (1939, 2019):
    print(
        f"{_y}-{str(_y + 1)[2:]}: {_d[_y]:>8,.0f} districts,"
        f" {_e[_y] * 1000:>12,.0f} pupils,"
        f" {_e[_y] * 1000 / _d[_y]:>6,.0f} per district"
    )
print(
    f"one-teacher schools:     {series['one_teacher_schools'][1909]:,.0f} (1909-10)"
    f" -> {series['one_teacher_schools'][2022]:,.0f} (2022-23)"
)
print(
    f"local share of revenue:  {series['local_revenue_pct'][1919]:.1f}% (1919-20)"
    f" -> {series['local_revenue_pct'][1979]:.1f}% (1979-80)"
    f" -> {series['local_revenue_pct'][2019]:.1f}% (2019-20)"
)
print(
    f"days attended per pupil: {series['days_attended'][1869]:.0f} (1869-70)"
    f" -> {series['days_attended'][1959]:.0f} (1959-60)"
    f" -> {series['days_attended'][2017]:.0f} (2017-18)"
)
print(
    f"full-day kindergarten:   {series['full_day_k_pct'][1970]:.1f}% (1970)"
    f" -> {series['full_day_k_pct'][2018]:.1f}% (2018)"
)
_fig, _grid = plt.subplots(2, 2, figsize=(11, 7.5))
(_size, _money), (_year, _kinder) = _grid

def _line(ax, key, label=None, **kw):
    s = series[key]
    ax.plot(s.index, s.to_numpy(), marker="o", markersize=3, linewidth=2, label=label, **kw)

_line(_size, "districts", "Regular school districts")
_line(_size, "one_teacher_schools", "One-teacher schools")
_size.set_yscale("log")
_size.set_title("The units got fewer, so each one got bigger")
_size.set_ylabel("Count, log scale")
_size.legend(loc="lower left", fontsize=9)

_line(_money, "local_revenue_pct")
_money.set_ylim(0, 100)
_money.set_title("Local money receded, then stopped in 1980")
_money.set_ylabel("% of school revenue from local sources")

_line(_year, "days_attended", "Days attended per pupil")
_line(_year, "term_days", "Length of school term")
_year.set_ylim(0, 200)
_year.set_title("The school year has been flat since 1950")
_year.set_ylabel("Days")
_year.legend(loc="lower right", fontsize=9)

_line(_kinder, "full_day_k_pct")
_kinder.set_ylim(0, 100)
_kinder.set_title("Kindergarten is where the hours arrived")
_kinder.set_ylabel("% of kindergartners in a full-day program")

_fig.tight_layout(pad=2.0)
savefig(_fig, "long-arc")
_fig
# The whole official record of elected school-district officials: four
# Census of Governments counts, 1967-1992, and nothing since. Typed in
# rather than parsed — both reports are scans:
#   1977 (GC77(1)-2), table 2 for the 1967 and 1977 columns, p.5 text for
#   the board-member split: https://www2.census.gov/programs-surveys/cog/tables/1977/elected-officials/1977-vol1-no2-electedoff.pdf
#   1992 (GC92(1)-2), "School District Governments" section, p.IX, which
#   also carries 1987: https://www2.census.gov/programs-surveys/gus/tables/1995/gc92-1-2.pdf
cog = pd.DataFrame(
    {
        "districts": {1967: 21_782, 1977: 15_174, 1987: 14_721, 1992: 14_422},
        "officials": {1967: 107_663, 1977: 87_062, 1987: 86_772, 1992: 88_434},
    }
)
cog["officials_per_district"] = cog["officials"] / cog["districts"]

# Pupils per elected official, at the nearest Digest enrollment reading —
# 201.10 samples decades here, so 1967 pairs with 1969-70 and so on, and
# 1992 has no nearby reading to pair with.
_pupils = series["enrollment_k"] * 1000
for _cog_year, _enr_year in [(1967, 1969), (1977, 1979), (1987, 1989)]:
    cog.loc[_cog_year, "pupils_per_official"] = (
        _pupils[_enr_year] / cog.loc[_cog_year, "officials"]
    )
cog.to_csv(RESEARCH / "cog-elected-officials.csv")
print(cog.round(1))

# The count opens in 1967, after the consolidation wave. A bound for the
# start of it, from this notebook's own 1939-40 readings and one stated
# assumption — a board needs about five members to function:
_seats_1939 = series["districts"][1939] * 5
print(f"1939-40 implied seats at five per board: {_seats_1939:,.0f}")
print(f"1939-40 pupils per implied seat: {_pupils[1939] / _seats_1939:,.0f}")
print(f"2019-20 pupils per seat at NSBA's 80,000 members: {_pupils[2019] / 80_000:,.0f}")
# Where the students sit today: Digest 214.20, districts and students by
# enrollment size of district. Digest 2022 is the newest edition to carry
# it, cached like the other workbooks.
_url = "https://nces.ed.gov/programs/digest/d22/tables/xls/tabn214.20.xlsx"
_path = RESEARCH / Path(_url).name
if not _path.exists():
    urllib.request.urlretrieve(_url, _path)
_sheet = pd.read_excel(_path, header=None)

_buckets = [str(_sheet.iat[2, _c]) for _c in range(2, _sheet.shape[1])]
assert _buckets[0].startswith("25,000"), _buckets

def _row(block, year="2021-22"):
    """The `year` row of the '{block}' panel, as a series over buckets."""
    _start = _sheet.index[_sheet.iloc[:, 1].astype(str).str.startswith(block)][0]
    for _r in range(_start + 1, _sheet.shape[0]):
        if str(_sheet.iat[_r, 0]).strip() == year:
            return pd.Series(
                pd.to_numeric(_sheet.iloc[_r, 2:].to_numpy(), errors="coerce"),
                index=_buckets,
            )
    raise ValueError(f"no {year} row under {block}")

size_dist = pd.DataFrame(
    {"districts": _row("Number of districts"), "students": _row("Number of students")}
).dropna()

_share = size_dist / size_dist.sum()
_big = _share.iloc[:2].sum()  # 25,000+ and 10,000-24,999
print(f"districts of 10,000+: {size_dist['districts'].iloc[:2].sum():,.0f}")
print(f"  = {_big['districts']:.1%} of districts, {_big['students']:.1%} of students")
_from_large = _share.cumsum()  # buckets run largest first
_from_small = _share.iloc[::-1].cumsum()
print("bucket where the median student sits:", (_from_large["students"] >= 0.5).idxmax())
print("bucket where the median district sits:", (_from_small["districts"] >= 0.5).idxmax())
_fig, (_seats, _where) = plt.subplots(1, 2, figsize=(11, 4.2))

_ppo = cog["pupils_per_official"].dropna()
_seats.bar([str(_y) for _y in _ppo.index], _ppo.to_numpy(), width=0.55)
_seats.set_title("The count opens after the dilution happened")
_seats.set_ylabel("Pupils per elected school-district official")

_sh = size_dist / size_dist.sum()
_pos = range(len(_sh))
_where.barh([_p - 0.2 for _p in _pos], _sh["districts"] * 100, height=0.38, label="Districts")
_where.barh([_p + 0.2 for _p in _pos], _sh["students"] * 100, height=0.38, label="Students")
_where.set_yticks(list(_pos), _sh.index, fontsize=8)
_where.invert_yaxis()
_where.set_title("One board per district, wherever the students are")
_where.set_xlabel("% of 2021-22 total")
_where.legend(fontsize=9)

_fig.tight_layout(pad=2.0)
savefig(_fig, "board-representation")
_fig
Coverage sets the limits before any claim does: the district count starts in 1939-40, the table 201.10 series run at roughly decade intervals — 15 to 20 points across a century and a half — and the kindergarten split exists only for 1970–2018.
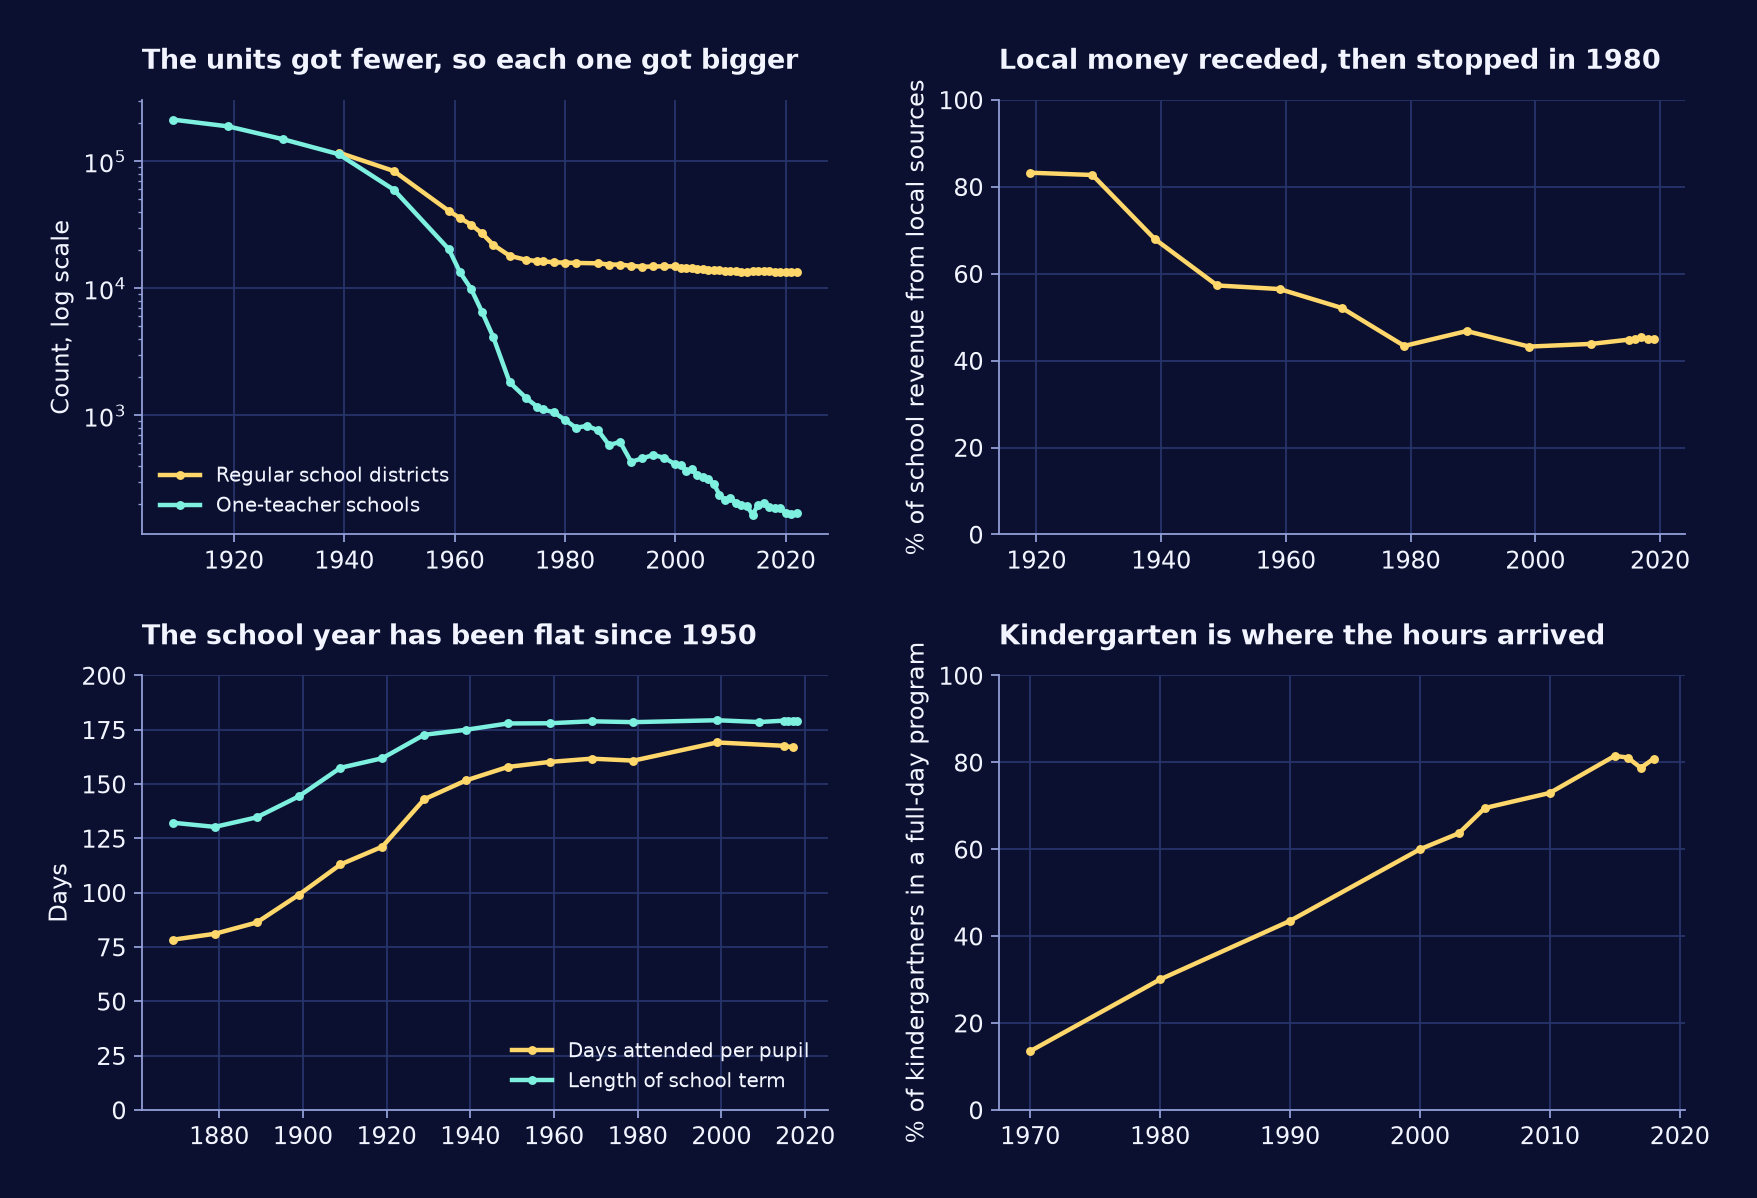
The bundle comes apart. Three of the four numbers do not tell the same story as the fourth.
The consolidation is real and it is enormous. Digest table 214.10 counts 117,108 regular public school districts in 1939-40 and 13,318 in 2022-23. Enrollment doubled over the same span, so the average district went from about 217 pupils to about 3,805 — seventeen times larger. One-teacher schools went from 212,448 in 1909-10 to 169.
Fiscal localism collapsed, and then stopped collapsing. Local sources paid 83.2% of public school revenue in 1919-20, 43.4% in 1979-80, and 44.9% in 2019-20 (table 201.10). The centralization is a 1920–1980 event. It has not moved in forty years.
The school year is not the mechanism. Average days attended per pupil went 78 in 1869-70, 160 in 1959-60, and 167 in 2017-18 — the whole increase happened before the consolidation wave finished, and the term itself has sat at about 179 days since 1950.
The hours arrived at the front end instead. Full-day kindergarten went from 13.5% of kindergartners in 1970 to 80.8% in 2018 (table 202.10). The half-day kindergarten in the dump is not a misremembering; it was the norm, and it is now the exception.
Then the third question, from the follow-up:
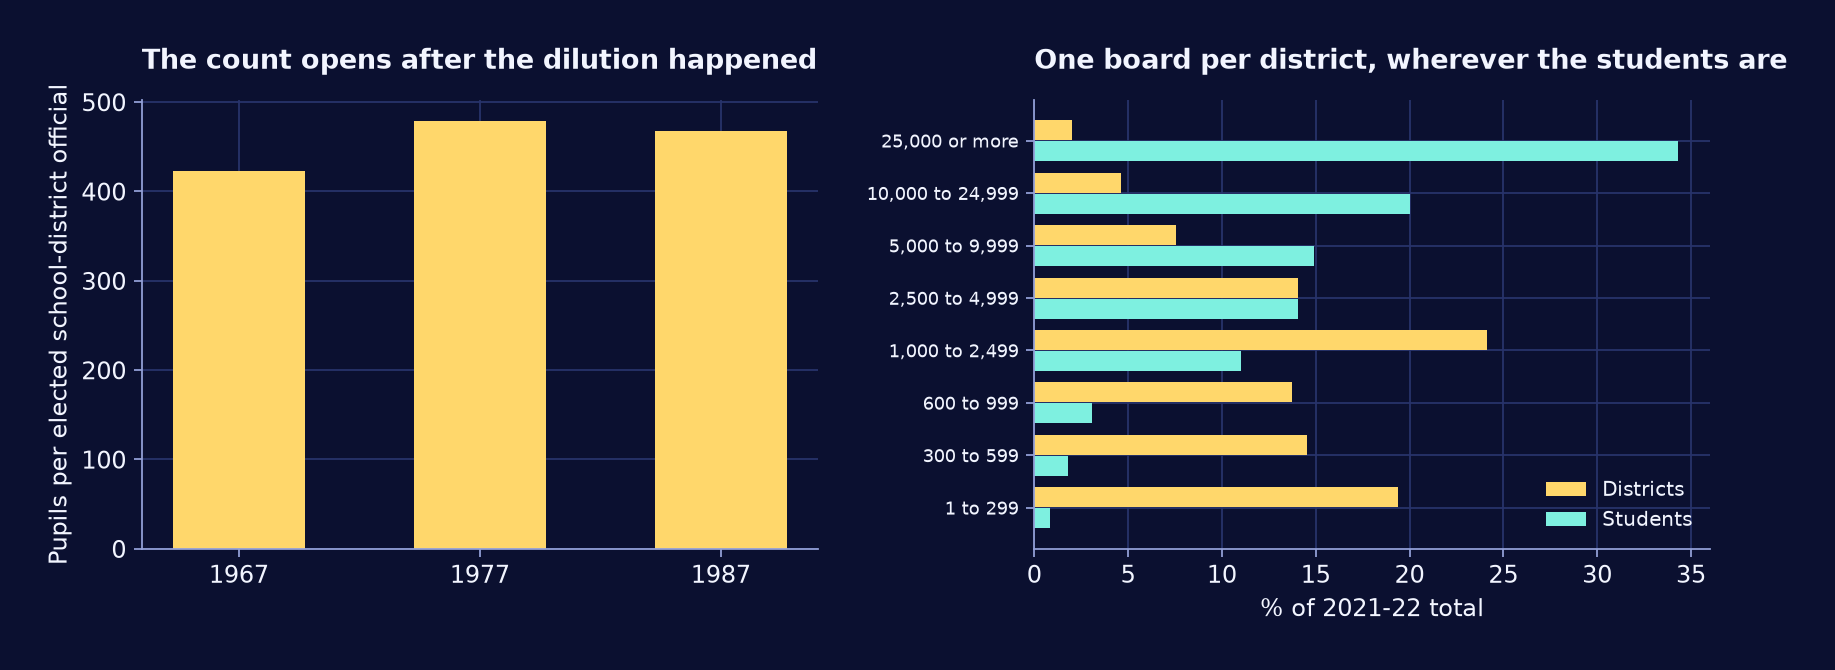
The board did not grow with the district. The only official count there has ever been — the Census of Governments’ Popularly Elected Officials, taken in 1967, 1977, 1987, and 1992, and then dropped — shows the average district carrying 4.9 elected officials in 1967 and 6.1 in 1992. The seats left with the districts: 107,663 elected school-district officials in 1967, 88,434 in 1992, and NSBA puts today’s membership at “more than 80,000.”
The record opens too late to watch the dilution happen. By the first count in 1967, one elected official already answered for 423 pupils, and the two later pairable counts sit at 478 and 467. In 1939-40 — 117,108 districts, 25.4M pupils — even five seats a board implies about 43 pupils per seat. The order of magnitude arrived between those dates, inside the consolidation wave, before anyone counted; at NSBA’s 80,000 the 2019-20 ratio is about 635. Howell puts it directly: between 1930 and 1970 states eliminated more than 100,000 districts and their governing boards.
The students live where the boards are scarce. In 2021-22 the 876 districts enrolling 10,000 or more — 6.6% of districts — held 54.3% of students (table 214.20). The median district has 1,000 to 2,499 students; the median student sits in a district of 10,000 or more. The boards mostly govern small districts, and the students mostly live in large ones.
What it doesn’t show:
- Fewer districts is not the same as less local control. It is a proxy, and the revenue series argues against reading it as the whole story: the money finished centralizing before most of today’s homeschooling parents were born.
- Nothing here measures the length of the school day. Days attended is an attendance average, not hours in a building — and hours per day is the number the dump is actually about. The Digest does not publish it.
- Table 214.10 counts regular districts, excluding regional service agencies, supervisory unions, and charter LEAs. That undercounts exactly the New England arrangement the dump reaches back to, where a town can still run its own school inside a supervisory union.
- NCES stopped publishing the full-day/part-day split after 2018. Digest 2019 is the last edition to carry table 202.10.
- Homework and extracurriculars are not in evidence, and one source says they are not there. Tom Loveless’s 2014 Brown Center Report reads NAEP’s long-term-trend homework question from 1984 to 2012 and finds the load “remarkably stable” for thirty years.
- The strongest disagreement is about which unit matters. Berry and West, Growing Pains (2010), find that larger schools lowered later earnings while larger districts were, if anything, mildly beneficial — the opposite sign from the “big district, remote bureaucracy” reading of the same consolidation.
- The official seat count covers elected officials of independent districts only. Dependent systems — 1,412 in 1992, run by cities, counties, or states — and appointed boards (3,321 appointed members in 1992) sit outside it, and 1992’s rise over 1987 is mostly Chicago’s 4,150 newly elected local school council members, not board seats.
- Nobody has counted the seats since 1992. The Census Bureau’s elected-officials compendium ended with that edition, so the modern end of the series leans on NSBA’s “more than 80,000” — an association’s figure, not a census. The 1939-40 end leans on an assumed five-member board; the true average is uncounted, though the two-orders-of-magnitude gap to 1967 survives any plausible board size.
- Seats per pupil is not influence per parent. Nothing here measures turnout, meeting access, or responsiveness. The ratio validates the arithmetic of distance, not the experience of it.
Next steps
- Hours in the building, not days on the calendar: the American Time Use Survey is the only direct measure of school time in a family’s day, back to 2003.
- The CCD’s instructional-hours fields put hours on the recent decades of the same question.
- State statutes on board size, to turn “one small board however large the district” from an average into the rule it appears to be.
- Turnout in school-board elections — the other half of “meaningful democratic input,” and the place where off-cycle election timing would show up.